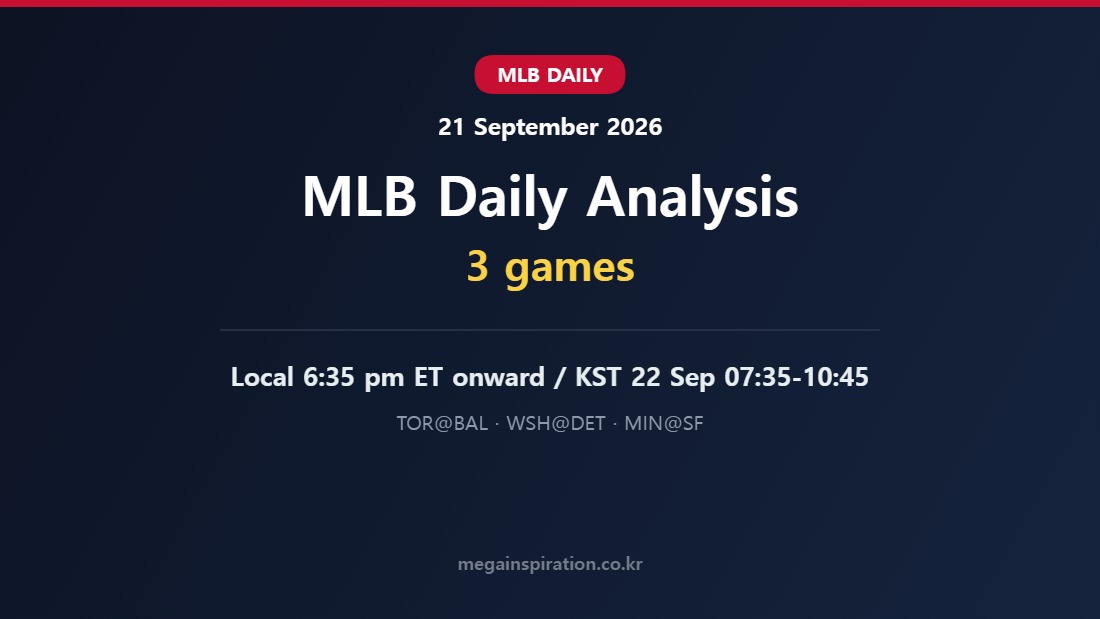

MLB · 21 September 2026
3 games
A light Monday slate: three games, first pitch 6:35 pm ET. That is 07:35 to 10:45 KST on 22 September.
Drag the ★ button onto your bookmarks bar to save it instantly. On mobile, long-press the button and choose “Copy link” or “Share”.
Three things to watch
- Only three games on the schedule — a travel Monday in the final week of the regular season.
- Toronto at Baltimore is an AL East 4th vs 5th matchup. Toronto leads the season series 6-4.
- Detroit have named River Ryan, who has no 2026 major league appearances. His last MLB outing was 2024.
Today’s games · 3
Toronto Blue JaysvsBaltimore Orioles
Oriole Park at Camden Yards · park index 97
Read analysisWashington NationalsvsDetroit Tigers
Comerica Park · park index 89
Read analysisMinnesota TwinsvsSan Francisco Giants
Oracle Park · park index 97
Read analysis| Local (ET) | KST | Matchup | Ballpark | Away SP | Home SP | Park index |
|---|---|---|---|---|---|---|
| 9/21 18:35 | 22 Sep 07:35 | Toronto Blue Jays vs Baltimore Orioles | Oriole Park at Camden Yards | Trey Yesavage | Shane Baz | 97 |
| 9/21 18:40 | 22 Sep 07:40 | Washington Nationals vs Detroit Tigers | Comerica Park | TBD | River Ryan | 89 |
| 9/21 21:45 | 22 Sep 10:45 | Minnesota Twins vs San Francisco Giants | Oracle Park | Bailey Ober | Blade Tidwell | 97 |
Park index is that ballpark’s runs per game across 2,332 completed 2026 regular-season games, scaled so the league average of 8.97 runs equals 100. Above 100 favours hitters.
American League East
| Team | W | L | PCT | GB | L10 | R/G | RA/G |
|---|---|---|---|---|---|---|---|
| 1. Tampa Bay Rays | 95 | 60 | .613 | – | 8-2 | 4.56 | 4.03 |
| 2. New York Yankees | 89 | 65 | .578 | 5.5 | 7-3 | 4.60 | 3.69 |
| 3. Boston Red Sox | 84 | 72 | .538 | 11.5 | 4-6 | 4.35 | 3.83 |
| 4. Toronto Blue Jays | 77 | 79 | .494 | 18.5 | 4-6 | 4.03 | 4.30 |
| 5. Baltimore Orioles | 75 | 80 | .484 | 20.0 | 5-5 | 4.47 | 4.65 |
American League Central
| Team | W | L | PCT | GB | L10 | R/G | RA/G |
|---|---|---|---|---|---|---|---|
| 1. Cleveland Guardians | 81 | 75 | .519 | – | 7-3 | 4.16 | 4.15 |
| 2. Chicago White Sox | 79 | 76 | .510 | 1.5 | 4-6 | 4.68 | 4.45 |
| 3. Detroit Tigers | 73 | 82 | .471 | 7.5 | 7-3 | 4.49 | 4.01 |
| 4. Minnesota Twins | 72 | 83 | .465 | 8.5 | 3-7 | 4.54 | 5.01 |
| 5. Kansas City Royals | 67 | 89 | .429 | 14.0 | 3-7 | 4.21 | 4.86 |
American League West
| Team | W | L | PCT | GB | L10 | R/G | RA/G |
|---|---|---|---|---|---|---|---|
| 1. Texas Rangers | 78 | 78 | .500 | – | 6-4 | 4.19 | 4.40 |
| 2. Houston Astros | 77 | 79 | .494 | 1.0 | 3-7 | 4.41 | 4.79 |
| 3. Seattle Mariners | 73 | 83 | .468 | 5.0 | 5-5 | 4.06 | 4.42 |
| 4. Athletics | 61 | 95 | .391 | 17.0 | 3-7 | 4.29 | 5.72 |
| 5. Los Angeles Angels | 60 | 95 | .387 | 17.5 | 5-5 | 4.03 | 4.54 |
National League East
| Team | W | L | PCT | GB | L10 | R/G | RA/G |
|---|---|---|---|---|---|---|---|
| 1. Atlanta Braves | 92 | 64 | .590 | – | 7-3 | 4.63 | 3.86 |
| 2. Philadelphia Phillies | 86 | 70 | .551 | 6.0 | 4-6 | 4.47 | 4.28 |
| 3. Miami Marlins | 76 | 80 | .487 | 16.0 | 4-6 | 4.44 | 4.46 |
| 4. Washington Nationals | 73 | 83 | .468 | 19.0 | 6-4 | 5.12 | 5.04 |
| 5. New York Mets | 71 | 85 | .455 | 21.0 | 3-7 | 4.28 | 4.54 |
National League Central
| Team | W | L | PCT | GB | L10 | R/G | RA/G |
|---|---|---|---|---|---|---|---|
| 1. Milwaukee Brewers | 97 | 58 | .626 | – | 8-2 | 5.15 | 3.87 |
| 2. Chicago Cubs | 87 | 69 | .558 | 10.5 | 6-4 | 5.35 | 4.38 |
| 3. Pittsburgh Pirates | 79 | 77 | .506 | 18.5 | 6-4 | 4.79 | 4.61 |
| 4. St. Louis Cardinals | 76 | 80 | .487 | 21.5 | 4-6 | 4.51 | 4.66 |
| 5. Cincinnati Reds | 72 | 84 | .462 | 25.5 | 3-7 | 4.12 | 5.16 |
National League West
| Team | W | L | PCT | GB | L10 | R/G | RA/G |
|---|---|---|---|---|---|---|---|
| 1. Los Angeles Dodgers | 95 | 60 | .613 | – | 7-3 | 5.01 | 3.78 |
| 2. San Diego Padres | 87 | 69 | .558 | 8.5 | 9-1 | 4.42 | 4.16 |
| 3. Arizona Diamondbacks | 81 | 74 | .523 | 14.0 | 4-6 | 4.42 | 4.45 |
| 4. San Francisco Giants | 64 | 91 | .413 | 31.0 | 4-6 | 4.23 | 4.75 |
| 5. Colorado Rockies | 57 | 99 | .365 | 38.5 | 2-8 | 4.66 | 5.79 |
Sources: schedule, ballparks, probable pitchers and division standings were pulled directly from the MLB official Stats API on 21 September 2026 (KST morning). Games back follows the official division table. The park index is calculated here from 2,332 completed 2026 regular-season games and is not MLB’s official park factor. Probable pitchers can change on game day.